RUNNER DEMOGRAPHICS – Statistics and Research
Nationwide Audience
5Kevents covers a variety of events all over the country. From running, kayaking, biking to triathlons, our customer engagement model connects your brand to the audience that is most interested.
Highly-qualified Customers
College-educated: Today’s core athletes are highly educated with 79% having earned a college diploma, compared with only 27% of the United States population.
Affluent: These athletes are affluent with 73% of those surveyed reporting a Household Income of more than $75,000, well above the U.S. median household income of $52,175.
Active Participants: Core athletes are active participants who train year round, reporting running/jogging/biking an average of 224 days and logging 1,357 miles per year, a significant difference compared with the typical fitness enthusiast who trains approximately 85 days per year.
| The National Runner Survey is distributed electronically to event participants, club members, specialty shoe store visitors, members of USA Track & Field, subscribers to running publications, and those who frequent the online running community. Running USA worked closely with more than 35 organizations to help distribute the online survey to various constituency groups between the months of August through December of 2009. A total of 11,264 runners nationwide (53% female, 47% male) responded to the survey with an 86% rate of completion. Select results from the 2009 study are presented below. The following female and male runner snapshots represent “core runners”, that is, active adult participants who tend to enter running events, train year-round, and purchase 2-4 running shoes each year. |
Are there certain industries that are more likely to sponsor running events?
Health care is huge, they are one of the biggest. On the national scene, we’ve seen automobile companies getting involved. And of course athletic shoes, apparel, sports drinks. But also financial institutions, banking, insurance. And sometimes things you wouldn’t maybe think of, such as Lasik surgery. It gets down to each company and their marketing plan.
What makes these events attractive for the sponsors?
The demographics are very good. A good portion of the participants are college educated. They have household income of well over $100,000 and even single income of over $75,000. They have credit cards, they eat out, they fly. And this is a very loyal group. You hear about how loyal Nascar fans are. I would venture to say runners are maybe second in that category. They appreciate people that promote their sport, and they realize sponsors are necessary for them to have these events. And what’s great is a sponsor can get a local, regional, national, and sometimes even international hit.
How are sponsors connecting with participants?
When sponsors are fully engaged with the event, they are being seen pre-event, at the event, and post-event. Technology has helped in that organizers now use social media quite a bit, email and so forth, sending out messages about the event. And when that is done, the sponsor is being seen that many times as well. With the larger events, there is an expo prior to the event when the runners pick up their packet, so that is additional opportunities for sponsors to do sampling or give out freebies. The runners’ packets can have their message inside, and we can also send messages to the runners’ friends and family to their mobile device to tell them how they are doing, and that can be sponsored. And then post, there is follow-up. So there are a lot of opportunities to reach these participants.
|
Typical U.S. Female Runner
|
Typical U.S. Male Runner
|
|
Demographics
|
|
|
|
|
Running History
|
|
|
|
|
Running Routine
|
|
|
|
|
Running Preferences
|
|
|
|
|
Motivation
|
|
|
|
|
Product Preferences
|
|
|
|
|
Health
|
|
|
|
Sources:
ACS = American Community Survey (2006 – 08). An annual nationwide survey distributed by the United States Census Bureau that collects updated and relevant data to provide communities a fresh look at how they are changing between the decennial census. Numbers reported reflect a three-year estimate between the years of 2006 and 2008. The ACS collects information such as age, race, income, commute time to work, home value, veteran status, and other important data. For more information, visit: http://factfinder.census.gov
National Runner Survey = The 2009 National Runner Survey is a product of Running USA. Approximately 11,264 runners nationwide completed the online survey distributed by running events, clubs, specialty shoe stores, USA Track & Field, and running publications. Variables measured include: demographics, sports participation, running history and routine, shoes, events, community resources, apparel, sponsorship, health/diet, technology, sports/fitness products, food/drink, and travel. Results include data segmentation for gender, runner type, and distance.
NSGA = National Sporting Goods Association. “National Sporting Goods Market in 2009” and the Sporting Goods Market with Historical Data CD, based on retail sales in the U.S. projected from consumer interviews. For more information, visit: www.nsga.org
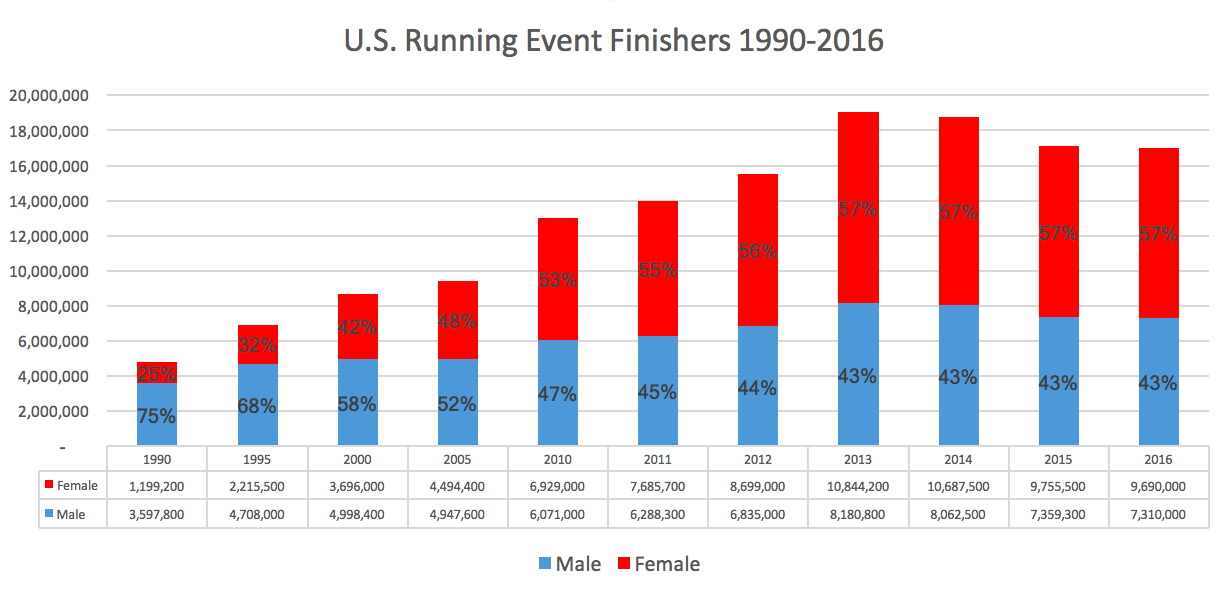
U.S. Running Event Finishers
Road race finisher total experiences slight year-over-year decline in 2016
WICHITA, Kan. – (March 23, 2017) – For the third straight year, the number of road race finishers declined in the United States, as 16,957,100 runners crossed a finish line in 2016, a one percent decrease from the 17,114,800 finishers in 2015.
Despite the decline, the finisher total leveled off from the nine percent decline seen in 2015, while the 2016 finisher total ranks as the fourth largest in history.
Between 1990 and 2013, finisher totals quickly grew from five million road race runners to over 19 million. Since 2014, the sport has seen a shrinking of sorts, as totals have now dropped under the 17 million finisher mark for the first time since 2012.
As the industry continues to look for ways to keep runners racing and their events growing, the decline is also being seen as a check on unhealthy races, seeing those with unsustainable structures leave the marketplace, allowing sound events to strengthen their foothold.
“While finisher totals continue to fall, however slightly, there are a number of positive signs for the industry,” said Running USA CEO Rich Harshbarger. “As race directors react to declining participation numbers, what we’re seeing is more of them increase value and create better experiences for their runners, partners, charities and communities.”
The number of organized races increased by 100 to 30,400 in 2016, but the number of races with 25,000 or more finishers decreased from 13 total in 2015 to ten in 2016, according to the Running USA Largest Races database. In addition, the 5K distance saw an increase in finishers in 2016, with 8,242.500 runners crossing the finish line. However, the 10K, half marathon and “other” distances saw decreases of four percent or greater. The marathon finisher total remained flat.
For access to the full U.S. Road Race Trends report, Running USA members can login to the membership portal and download the PDF copy.